 |
AGATE DESIGN |
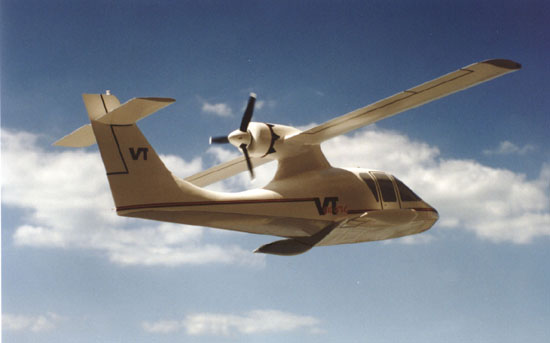
| EXECUTIVE SUMMARY | A one-ninth scale
model of the VenTure was constructed to provide wind tunnel test
data that would validate results of the design process and to provide a
display model. The model was built using basic composite construction
techniques involving foam, fiberglass, and wood. Figure
14 is a photo of this model.
As the design was finalized, drawings and templates were made using several Computer Aided Design (CAD) programs. The wing span was set at four feet to provide adequate clearance from the sides of the wind tunnel to allow accurate data collection in the Virginia Tech Stability Wind Tunnels 6x6x24 test section. The finished product was put into the wind tunnel on April 21, 1997 (Figure P.4). Tests were performed on the 0.114 scale model of Venture in the wind tunnel. The model was mounted at the center of the test section on a shrouded 6 component strain gauged strut support and turntable. Then, during testing, data was taken by an automated data acquisition system which also controlled VenTure's angle of attack. Three series of tests were run in the wind tunnel. The first of which was run at very low speeds, and intended to examine the strength of the model as well as the general aerodynamic behavior. The second series was run at a dynamic pressure of 10.4 psi. The VenTure's base was reinforced and boundary layer transition strips were placed at key locations. The final series of tests was run with the model "tufted" for a visualization of the surface flows (Figure P.5). Each test series collected data at one degree angle of attack increments as the model was cycled from stall to beyond. The resulting data proved to be consistent and useful, even for the first series of low speed tests, and showed VenTure's aerodynamics to be well behaved. However, experience shows that drag measured on student built models are normally higher than they would be on professionally manufactured wind tunnel models (Ref. P-1); hence, these tests results almost certainly overstate the drag and under-represent the lift-to-drag ratio. The purpose of examining such data was to verify the general trends predicted analytically for the aircraft design. These results did so, showing the design to have well behaved aerodynamic forces and a desirable nose down pitch in stall. Sample test data is shown below in Figure 15 and in Appendix P, Figure P.6. Further tests of the model are planned in order to investigate the effects of yaw and Reynolds number. Plans also include the construction of a model for towing tank testing and a radio-controlled flying model for flight testing. * The Stability Wind Tunnel was originally built at NASA Langley, and is a research quality test facility with a 6' x 6' x 24' test section that provides outstanding flow qualities and top speeds of up to 175 mph. |