 (1)
(1)
Characterizing how an engineering structure will deform under a steady load is key to the design and development of a broad range of engineering hardware. Theoretical methods for predicting deformation, such as you have already met in ESM 2204, AOE 3094 and AOE 3024, obviously have an important role to play. However, the structural elements of real vehicles are often complex consider the wing of a large transport aircraft, the rudder assembly of an oil tanker or the robotic arm of a space probe. Theoretical methods, by themselves, are not completely reliable for such real-world structures. Predictions for these structures inevitably involve simplifying assumptions about the structure and material, and will be based on incomplete or uncertain information about the environment (i.e. the boundary conditions) in which the structure must operate. Experimental testing of structures is thus important. Testing is used not just to prove that the final design works as intended, but also to examine whether the theoretical models or boundary information used to predict the behavior of the structure are correct and complete. Testing is subject to error as well. Thus a good experiment characterizes not just the properties of the structure in question, but also investigates and quantifies the errors in the measurements themselves. Only then can one be sure enough to make decisions, based on the test, that influence the form of the vehicle, the success of the mission, or the lives and investments that they may involve.
The objectives of experiment 2 are:
1. to introduce you to some basic techniques used to measure the static
deformation of a structure,
2. to provide you with a set up where you can use those techniques
to examine validity and consistency of a simple theoretical approach (beam
theory) when applied to a simple real-world structure,
3. to provide you with a set up where you can investigate the validity
and accuracy of the measurement techniques themselves.
You will find that this manual does not prescribe a specific set of
measurements you should make or conditions you should test. These will
be your choices to make as a group, based upon your understanding of the
theory, the set up and measurement techniques, and the specific goals provided
for you. It is therefore critical that you prepare for this lab by making
sure you understand and can use the theory, are familiar with the descriptions
of the measurement techniques and experimental set up as described below,
and are organized as a group. Two complete, nominally identical, sets of
testing equipment are provided during the lab period so that different
tests can be carried out by different members of the group simultaneously.
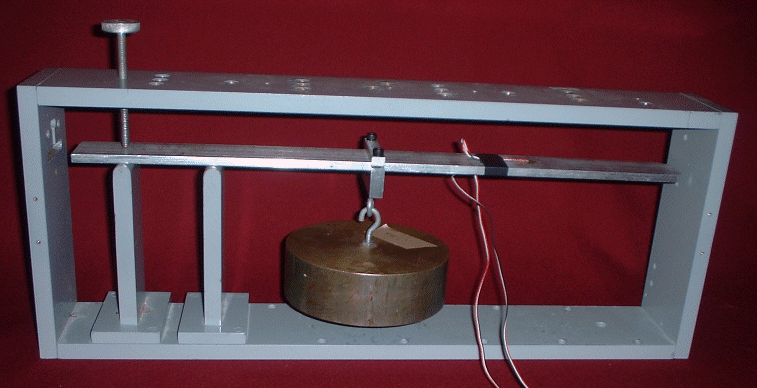
The apparatus to be used in this experiment consists of a simple beam (this will be your test structure), a frame in which that beam can be mounted and its deformation measured, and a loading fixture that allows weights to be attached to the beam.
The Beam
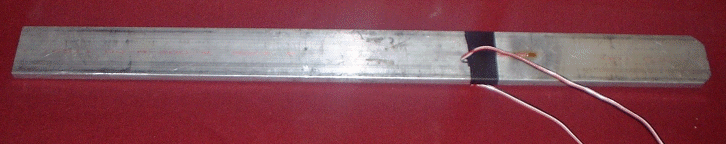
The beam, shown in figure 1 , is constructed from
aluminum alloy and has a rectangular cross-section that is nominally 1/4
by 1 1/2-inches. The corners at one end of the beam are beveled. You should
measure the actual cross-sectional dimensions with the dial
caliper provided, and use those actual dimensions in any calculations you
perform (note that the two beams may have slightly different dimensions).
Attached to the beam are two electrical resistance strain gages, one on each side. As you learned in the online lecture, the stretching of an electrical conductor increases its resistance. The gages are designed to take advantage of this effect to measure the strain. They consist of a single conducting strip deposited on a film that is then glued to the beam. At first sight the conducting strip appears to have the form of a simple rectangular region. On closer inspection, perhaps with a magnifying glass, you will see that in fact the conducting region consists of a thin conducting path that zigzags back and forth along the long axis of the beam. Confirm in your own mind that this will make the gage primarily sensitive to normal strains along that long axis. Be careful of the strain gages and their electrical connections, they are delicate and may be important for your test.
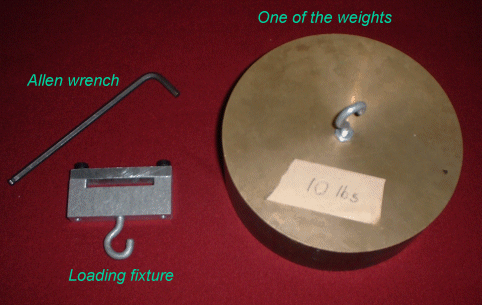
Loading Fixture and Weights
The loading fixture and one of the weights are shown in figure
2 . The two Allen bolts in the loading fixture can be loosened so that
it can be slid onto the beam. Do not slide the loading fixture over the
strain gage. Completely remove the fixture (by undoing the Allen bolts
using the key provided) if you need to move it from one side of the strain
gage to the other. The weights are machined from aluminum bronze rod stock
of 5-inch nominal diameter. They are nominally 2, 3, 5, 10, and 15 pounds,
and each has a hook threaded into a tapped hole on one side for hanging
them from the eye screw of the load fixture. A digital weighing machine
is provided for you to measure the exact values of these weights, the loading
fixture and any other items you feel are relevant.
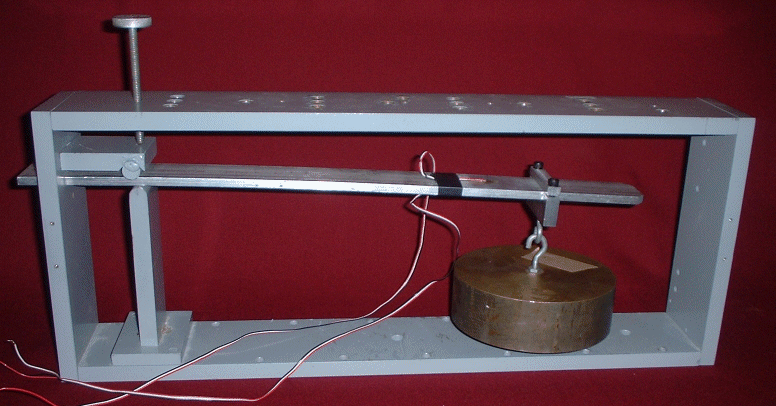
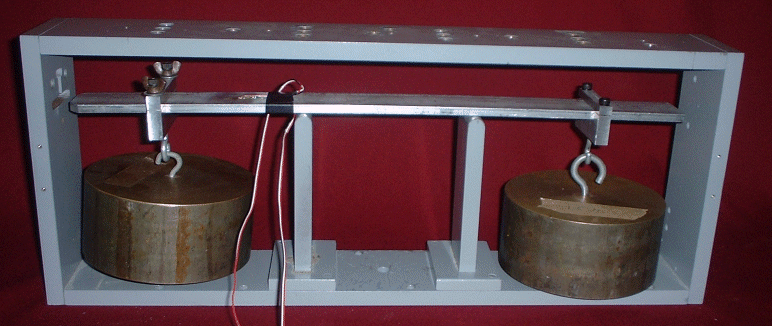
The Frame
The loading frame, built according to a design developed by Durelli
et al. (1965), is shown in figure 3 with the beam,
loading fixture and weight assembled in one possible configuration.
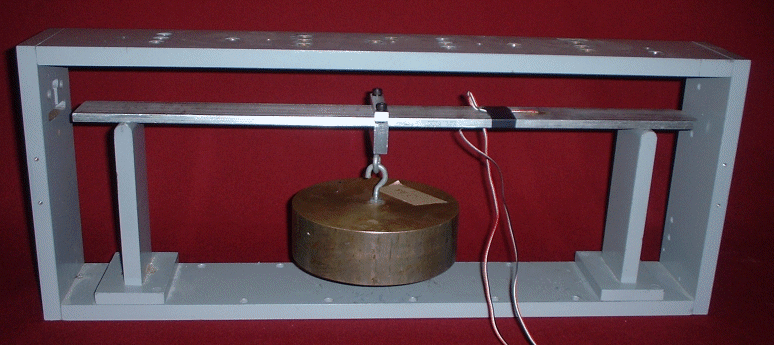
The frame includes two vertical beam supports of the same height. These can each be placed at any one of 7 positions along the bottom of the frame. The positions are at exactly 2.5 inch intervals. The beam can also be fixed using the slot cut into the left hand side of the frame, and the clamp, see figure 3 . The slot holds the beam at the same height as the vertical supports. The clamp is tightened using Allen bolts on the outside of the frame, and a threaded knob that passes through the top of the frame. With the with one of the beam supports in its left-most position, the clamp and slot can be used in combination to approximate a cantilever support. Note that if used, the both the bolts and threaded knob must be tightened firmly to produce a repeatable support. A second threaded knob and other threaded holes for the these knobs are provided along the top of the frame, so that it is possible to pin the beam to vertical supports at other locations along the frame, if necessary.
The top of the frame contains a series of machined holes, spaced at two inch intervals along the frame. These holes are designed to accept dial indicator gages to measure beam deflection. Figure 3 shows an indicator mounted in one such hole. Note that, for this particular beam configuration, this indicator wouldn't tell you very much, as it is located at a position where the beam deflection is ensured to be zero by the vertical support.
Note that this device is very flexible and allows for many beam configurations.
It is thus ideal for testing simple theoretical predictions or measuring
material properties and assessing instrumentation limits and errors through
beam theory. For example, figure 4 shows an arrangement
producing a cantilevered beam, figure 5 shows a simply
supported beam, and figure 6 shows a simply supported
beam with overhang. Note that
Figure 3 shows an indeterminate beam configuration.
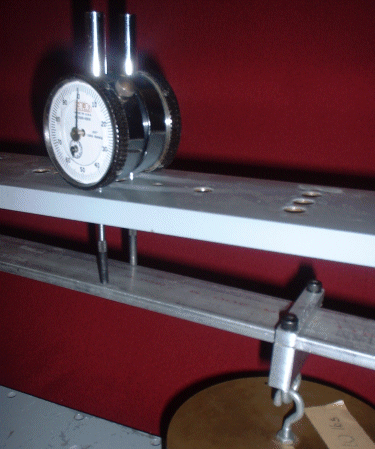
You have a variety of instrumentation available with each set of apparatus. Minor items include a ruler which you can use to accurately position the beam and the loads, a dial caliper to check beam dimensions and a digital camera which you can use to record your various set ups, and photograph items that you want pictured in your logbook. Your lab TA will be able to explain operation of the digital camera to you. The remaining items of instrumentation are those used to measure the beam deformation, namely the dial indicators and strain gage system.
Dial Indicators
A number of basic mechanical dial indicators (see figure 3 )
and two electronic indicators (not pictured) are available to measure
beam displacements. Either type may be inserted through the holes on the top of
the loading frame so that the end of the plunger rests on the beam or, if it at
the same location, the top of the loading fixture.
The mechanical dial indicators are manufactured by the Chicago Dial Indicator Company (Des Plaines Il), model number 2-C100 1000. Each gage has a range of one inch with each graduation on the large dial representing one thousandth of an inch. One complete revolution of the pointer on the large dial represents a displacement of 0.100 inches. The number of revolutions are counted on the small dial. It is possible to set the large dial to read zero, for example when the beam is unloaded, by loosening the thumb screw on the top right of the dial and rotating the outer ring of the dial face. In principle it is possible to read thes indicators to four significant figures by visually estimating the location of the needle between the smallest divisions on the scale.
The electronic indicators, Mitutoyu Model 575-123, have a range of one inch and read in increments of 0.0005 inches, and are generally easier to use. They have inch/metric conversion, zero setting to any position, +/- counting direction, and position memory (the dimension indicated always reflects the movement of the stem from the last set zero position, also known as absolute (ABS) positioning). Their accuracy is ±0.0008 inches. Note that this is greater than their resolution. When inserting the electronic indicators into the holes in the loading frame, thread the indicator spindle through one or two of the washers provided at the workbench. This will raise the body of the indicator a few mm and enable it to work when the beam is in the unloaded position, or higher.
Note that the above accuracies are under ideal conditions and you may find that other factors tend to overwhelm the level of accuracy, particularly for the mechanical indicators. One of these factors is that the spindle of the dial indicator may stick. You can usually avoid this by sliding the spindle in and out a few times to loosen the gears before the indicator is installed. A second factor that may influence the accuracy of your measurements is the force exerted by the spindle on the beam, and the variation of that force with extension of the spindle. You should be aware of this factor as you proceed with your test, so that you are prepared to quantitatively assess its influence (and perhaps correct for that influence) during your tests.
You can also use the dial indicators to check that the load is supplied symmetrically to the beam. This can be done by inserting two dial indicators into the loading frame such that their spindles contact the beam at two widthwise points on the top surface that have the same spanwise location ( figure 8). By monitoring the readings of these two dial indicators to make sure they remain the same, you can establish that the beam does not twist under load, and thus that no torque is applied to the beam as it is loaded.
The electrical resistance strain gages bonded to each beam are manufactured by Micro-Measurements Division, Measurements Group, Inc., Raleigh NC. As described above they consist of a single conducting strip deposited on a film that zigzags back and forth along the long axis of the beam. The gages are therefore sensitive to strain in that direction. Technically, the gage designation number is EA-13-125BZ-350. The "EA" of this designation indicates these are polyimide-backed constantan material foil gages, the "13" designates the self temperature compensation of the gage with respect to aluminum, the "125" designates that the active gage length is 0.125 inches, "BZ" denotes the grid and tab geometry (narrow, high resistance pattern with compact geometry), and the "350" means the resistance of the gage in ohms. The engineering data sheet for these gages is included with the experimental set-up. To set up the strain gages you will need the gage factor from this data sheet, of 2.145.
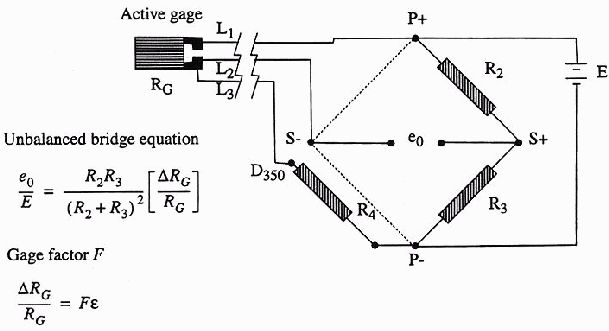
Since the strain gage is just a single conductor, there are only two connections to make, one at each end. You will notice there are three wires coming from each gage. The red wire connects to one side of the gage. The black and white wires both connect to the other side. The strain gage is operated using the Wheatstone bridge circuit that you were introduced to in class, in a quarter bridge configuration. This circuit, shown in figure 9 is arranged in a diamond shape. Three sides of the diamond consist the simple resistors, R2, R3 and R4. The strain gage itself is connected to the fourth side of the diamond. Voltage is applied to the top and bottom corners of the diamond, P+ and P-, and the output signal, which will be a voltage proportional to the resistance of the gage and thus the strain it experiences, is measured across the left and right corners of the diamond, S+ and S-. Note that the points S- and D350 on the diagram are actually connected together through the leads to the strain gage.
The Wheatstone bridge circuits for our strain gages are provided by a Measurements Group model SB10 Switch and Balance Unit, figure 10 . Strain gages are connected into its bridge circuits using the array of electrical terminals on the right hand side of the unit. Note that there are 10 sets of terminals, each labeled P+, P-, S+, S- D corresponding to the 5 points in the bridge circuit in figure 9 . There are 10 rows of terminals because this unit actually contains 10 bridge circuits that could be used to operate 10 strain gages simultaneously. We, of course, will only need to use rows 1 and 2 for the two strain gages on the beam. Consistent with figure 9 one side of the first gage (the red wire) is connected to the P+ terminal in row 1. The other side of the gage (black and white wires) are connected to the S- and D terminals of row 1. The second gage is connected in the same way to row 2.
To supply the voltage to the P+ and P- terminals of the bridge circuits, and to read the strain from the S+ and S- terminals we have a Measurements Group model P-3500 Strain Indicator, also shown in figure 10. Obviously this device has to be connected to the switch and balance unit containing the bridges. The connections are straightforward. Use the banana plug cables provided to connect P+ on the P3500 to P+ on the SB10, P- to P-, S+ to S+, S- to S- and D350 to D. You should also connect the two ground (GND) sockets. The black knob on the left hand side of the SB10 controls which of the bridge circuits, and thus strain gages the strain indicator is connected to.
For the switch and balance unit to accurately output the strain the gage factor (of 2.145) must be entered. This is done by pressing the 'Gage factor' button (3rd from left) and adjusting the knobs immediately above it so that the display reads '2.145'. It is likely that the gage factor will be set equal, or close, to this value already. To use the strain gage system to make a measurement, first select the gage you are interested in (black knob SB 10) then press the 'Run' button (4 from left on the P3500). The display shows the strain in microstrain (strain times 106). That is, a reading of 1234 means a strain = change in length / length = 0.001234. Your measurement will be the difference between this displayed value when the load is applied, and when it is not. Note that for convenience you can usually set the offset of the display to zero when there is no load by turning the 'balance' knob on the SB-10 that corresponds to the strain gage you are looking at.
If you need further help setting up or understanding this system instruction
booklets are provided with both the SB10 and P3500 units.
A. Beam Displacement
For a symmetric cross section beam made of a linear elastic material,
whose displacements and slopes under load are small relative to its undeformed
configuration, the relationship between the displacement and bending moment
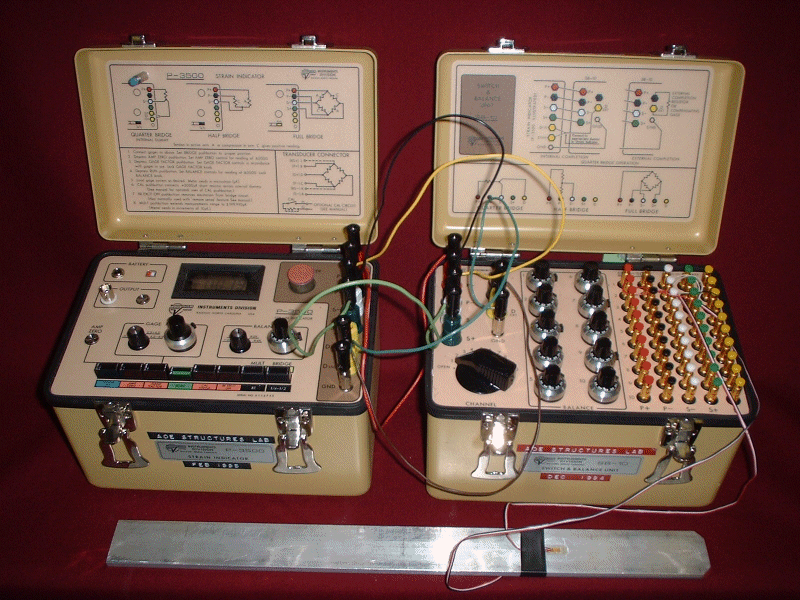
in the technical theory is
(1)
in which EI = EIxx designates the bending stiffness (dimensional units of F-L2), E is the modulus of elasticity of the material (F/L2), and I is the second area moment of the cross section (L4) about the horizontal neutral axis (x-axis in the cartesian x,y,z system). For a rectangular cross section beam
![]() (2)
(2)
where b is the width (x-direction) and h (y-direction) is the height.
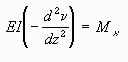
B. Strains
The axial normal strain in the beam, ![]() z,
is proportional to the moment and is given by
z,
is proportional to the moment and is given by
 (3)
(3)
where y = h/2 at the bottom of the beam and y = - h/2 at the top of the beam.
C. Influence coefficients
For a linear elastic structure such as our beam the displacements are
proportional to the applied loads, as long as those displacements and associated
rotations remain small. Consider two locations on a beam, 1 and 2, two
point loads applied at those locations, P1 and P2,
and the corresponding displacements they produce, v1 and
v2 . (The displacements and loads are said to be corresponding
if at each point the load and displacement are measured along the same
line of action and in the same sense positive.) Then, the proportionality
of the displacements to the loads is written as
![]() (4)
(4)
![]() (5)
(5)
in which ![]() i,j
(for i,j = 1,2) are called flexibility influence coefficients.
The flexibility influence coefficients depend on the material properties,
the locations where the corresponding loads and displacements are measured,
and on the directions in which the corresponding loads and displacements
are measured. Maxwell's reciprocal theorem states that the displacement
at point 1 due to a unit load at point 2 is equal the displacement at point
2 due to a unit load at point 1, if displacements and loads are corresponding.
In terms of the flexibility influence coefficients, the reciprocal theorem
states
i,j
(for i,j = 1,2) are called flexibility influence coefficients.
The flexibility influence coefficients depend on the material properties,
the locations where the corresponding loads and displacements are measured,
and on the directions in which the corresponding loads and displacements
are measured. Maxwell's reciprocal theorem states that the displacement
at point 1 due to a unit load at point 2 is equal the displacement at point
2 due to a unit load at point 1, if displacements and loads are corresponding.
In terms of the flexibility influence coefficients, the reciprocal theorem
states
![]() (6)
(6)
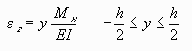
Solution: The first step in determining the displacement of the beam write down the bending moment as a function of distance z by using statics. In this case we have
 (7)
(7)
where the origin of z is at the left hand vertical support. (To make sure you are comfortable doing this, try writing down the form of the moment distribution for one or more of the other cases shown in figures 3 through 7.) To find v(z), Eq. (7) is substituted into (1), then this result is integrated with respect to z twice in each half of the beam, and the four constants of integration (two from each half) are evaluated by imposing the kinematic boundary conditions. In this simple support case, the kinematic boundary conditions are v(0) = 0, v(L) = 0, and continuity of v and dv/dz at z = L/2. The result is
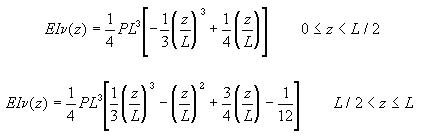 (8)
(8)
Consequently, the midspan displacement is
A. Getting familiar with the apparatus and instrumentation.
The following procedure is designed to help you get a feel for the
apparatus and instrumentation and, most importantly, its limitations. This
is a group activity, but one in which it is important that you get individual
hands on experience and that everybody understand and appreciate the items
and issues raised below.
Discussion is key - each student must know how to use the apparatus, what
the problems are, what measurements (in addition to those made by the dial
indicators and strain gages) will be critical. Ensure that all the important
observations (measurement/error lists, error estimates etc.), both qualitative
and quantitative are properly recorded, along with any explanations, in
the electronic lab book.
Goal 1. Design, conduct and document a sequence of tests to measure,
as reliably as possible, the Young's modulus of the beam material, and
to to put a number on the reliability (i.e. the likely error, a.k.a. the
uncertainty).
Suggestions. Such a test will obviously require some application
of beam theory. The reliability of your result, and your ability
to estimate that reliability, will be enhanced if you make multiple determinations
of Young's modulus. For example, it is easy to make multiple measurements
for a sequence of different loads. Even better are multiple measurements
obtained in situations where the errors are unlikely to be the same, i.e.
using independent measurement techniques and/or using different beam configurations.
Keep careful documentation of what you do, why you do it, set up, characteristics,
expected results, unexpected results, analysis, photos and plots in the
electronic lab book as you proceed. Analysis should include uncertainty
estimates for all results.
Goal 2. Design, conduct and document a sequence of tests to examine
the validity (and extent of validity) of Maxwell's reciprocal theorem.
Again, you should aim to gather whatever information you need to assess
how good your result is.
Suggestions. Do not feel constrained to a single 'reasonable'
test. How unreasonable can the test be? How far apart can your two locations
be? what may be between them? is there a limit to the deflection for the
theorem to be valid? can you use the strain gages (you can at least use
them to get additional data points on Young's modulus, for goal 1)? what
about the sources of error you identified above? Keep careful documentation
of what you do, why you do it, set up characteristics, expected results,
unexpected results, analysis, photos and plots in the electronic lab book
as you proceed. Analysis should include uncertainty estimates for all results.
If you are satisfied that you have completed the above goals, you are free to experiment further as you wish (e.g. testing beam theory by measuring complete deflection distribution, attempting an indeterminate beam structure). Note that your grade does not depend upon how close your results agree with beam theory, Maxwell's theorem or any other pre-conception of what the answers should be. Instead it depends upon how open mindedly and objectively you assess your data, its accuracy, and what it shows, or appears to show when combined with the theory.
The group should leave few minutes at the end of the lab period for discussion
and to check that everybody has everything they need. As a group go through the
exit checklist.
Before starting your report read carefully all the requirements in appendix 1.
Title page
As detailed in appendix
1 .
Introduction
State logical objectives that best fit how your particular investigation
turned out and what you actually discovered and learned in this
experiment (no points for recycling the lab manual objectives). Then summarize
what was done to achieve them. Follow this with a background to the technical area of the test and/or
the techniques and/or the theory (and its mathematical results). This material can be drawn from the manual (no copying),
the online class or even better,
other sources you have tracked down yourself. Finish with a summary of the layout of the rest of the report.
Apparatus and Instrumentation
Begin this section with a description of the beam, loading frame
and related hardware, and connect these items to your goals. For example, you might write "A
frame of the type designed by Durelli et al. (1965) was used to
load the beam in several configurations for the purpose of determining
its Young's modulus." Labeled dimensioned diagrams of the beam(s) and strain gages
are probably critical. Labeled photographs may suffice for other items.
Don't forget to objectively describe any deficiencies, irregularities,
imperfections in the apparatus relevant to your goals, and given any primary
uncertainties. Then describe the
instrumentation used to monitor the beam, how it was used, and its accuracy
and limitations. For example "The dial indicators were inserted through
the top of the frame to measure beam displacement. These indicators allowed
measurements to a resolution of... but their actual accuracy was reduced
to about ... inches as a result of ... The indicator spindles exerted a
force on the beam of about ??? which complicated measurements somewhat
(see below), particularly when... Dial indicators were also used to check
for twisting...". With your description of the strain gages include a circuit
diagram, and properly reference the manufacturers and model numbers. If
there were any uncontrolled variables in your experiment this is a good
place to mention them and assess there likely impact, for example -
"For the three point bend test the location of the load was set visually
at centerspan but, due to an oversight, the actual location was not measured
or checked. The maximum error in the load location is estimated at 0.25
inches and the implications for this error for the results of this test
are discussed with the results below" - or - "While two actual beams were
used during the tests, the data were combined as though they referred to
a single structure. While the differences in dimensions were small, it
is not actually known that the beams were constructed from the same type
of aluminum alloy, introducing a potential error into the results. The
maximum size of this error is estimated through further analysis of the
beam results in the following section". Such honest assessments greatly
raise the quality of a report (and your grade)
Results and Discussion
Before writing the results and discussion make sure all your results
are analyzed and plotted, and any theoretical derivations have been completed
and compared. Make sure your plots are formatted correctly - default Excel
plotting format is not acceptable, see appendix
1 . Plotting results in more than one way may make them clearer or
serve more than one purpose. For example, you may have plotted beam displacement
against load for each of a series of configurations for the purpose of
illustrating the beam deformations used in estimating Young's modulus.
Once you have computed a value of Young's modulus for each measurement/configuration,
you may then consider plotting the whole set of estimates together, say
against displacement to see of the fact that the deformations are actually
finite has influenced the estimates (the error would increase with load).
Alternatively you might consider cross-plotting estimates obtained separately
from the strain gages and dial indicators against load. That might reveal
any errors associated with additional forces, from the loading fixture
say. Such pictures make it much easier for you to explain and discuss the
significance and implications of your results.
Since the beam configurations you used are probably key to your goals they may well be best shown and described in this section along with the results. You will really need clear dimensioned and labeled diagrams for these.
A good way of writing this section may be to tie each set of tests and results to one of your objectives stated in the introduction. (If you find it hard to do this, try changing your objectives!) For example, you might begin with "The beam was tested in two configurations for the purpose of determining the Young's modulus of the aluminum from which it was constructed. The two configurations, a three-point bend test and a cantilever test, are illustrated in figures 7 and 8. Loads of ??? were applied at the locations marked with the symbol 'P'. Figure 9 show the displacements measured at the dial indicator locations (marked 'A') plotted against nominal load. Figure 10 shows strains measured on the at locations 'B' on the upper and lower surfaces of the beam. Note that the results do not show exactly a straight line behavior....due to non-repeatability in the... To use these results to estimate Young's modulus, it is necessary to use technical theory to analyze the beam deformation. As a first step, we note that the moment distribution for these two beams can be written as: ... (note coordinate directions defined on figures 7 and 8)......The estimates of Young's modulus based on equation ?? and the dial indicator results are shown in...Estimates based on ... strain results..." Don't forget to describe your plots. If you have trouble finding deeper things to say about a plot, ask yourself why you are presenting it.
Make sure your results and discussion include (and justify) the conclusions you want to make. Also remember to include any uncertainty estimates in derived results. You should reference a table (copied out of your Excel file) or appendix containing the uncertainty calculation.
Conclusions
Begin with a brief description of what was done. Then a sequence of
single sentence numbered conclusions that express what was learned. Your
conclusions should mesh with the objectives stated in the introduction
(if not, change the objectives) and should be already stated (although
perhaps not as succinctly) in the Results and Discussion.